Which test is the most accurate?
We recently reported on the impressive range of a Chinese-built EV, which unleashed the fury of many a commentator about foreign range claims being far more lenient than US EPA figures. These comments are valid.
The main problem is the various test cycles used across the globe, some of which inevitably give a car a more favorable result than the stringent EPA tests conducted in the USA. We used to include a disclaimer regarding the Chinese CLTC test but eventually dropped it, assuming that everyone knew about it. But you know what they say about assumptions.
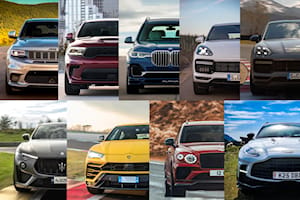
But just how different are the various claims for cars from various countries? Let's clear the air and discuss the various tests out there, starting with the most contentious first.
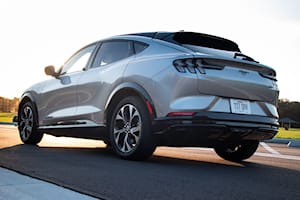
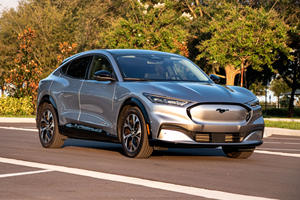
To be clear, even the EPA gets it wrong. For proof, look at the consumption figures the EPA receives from owners. Around 90% of the time, a car is far more efficient than the EPA initially claims, and this is especially true when it comes to electric vehicles. We know for a fact that you can get more out of a Ford Mustang Mach-E than the EPA claims.
Chinese manufacturers either use the European NEDC or the China Light Duty Vehicle Test Cycle, the CLTC. This test is split into two parts; one for passenger cars and one for commercial vehicles.
The CLTC is not as easy to pass as some might think. While it's true that the CLTC has a lower average speed than every other efficiency test, the cars are subjected to more braking and acceleration.
The total distance of the passenger car test is just over nine miles. It takes precisely 30 minutes to complete the test, at an average speed of 18.1 mph. It reflects the average day in the life of a Chinese car, which is stuck in traffic most of the time.
The test consists of three phases, with a top speed increase in each step. Phase three tops out at just under 120 km/h (75 mph). In phase one, the car accelerates and stops seven times. Phase two accelerates and stops three times, but more in-gear acceleration is included. Phase three mimics highway driving, accelerating from a standing start, changing speed multiple times until it comes to a halt.
The NEDC was created in 1997 to emulate the average use of a car in European conditions. It was meant to take place on a long straight piece of road, but since the Europeans don't have control of the weather, the test was eventually moved to a roller test bench at a fixed temperature of 77 degrees Fahrenheit.
What you might not know is that the test bench can emulate resistance, whether it be from mass or drag. In any case, it doesn't matter since the NEDC is now defunct, with the WLTP being the accepted global standard.
Why was the NEDC test cycle canned? In simple terms, the parameters used were ridiculous.
To give you one example, we'll look at the acceleration part of the Urban Cycle test.
The car was started, left standing for 11 seconds, after which it slowly accelerated to 24 mph over 4 seconds. After that, it stays at 24 mph for 8 seconds, then slows down to a stop over 5 seconds.
The next big step was accelerating to 50 mph in 12 seconds...
You can probably see what the problem was. Nobody drives that slowly.
In addition to these favorable conditions, all of the vehicle's features were turned off. You know, things like climate control, radio, and massaging seats, which no one ever uses. (That's sarcasm, just to avoid confusion.)
Since it took place in a laboratory, the temperature was set between 20 to 30 degrees Celsius. That's a nice warm but not entirely heatstroke-inducing day in American terms.
As you can see, there was still room for improvement, which is why the World Light Test Procedure (WLTP) was developed.
The WLTP was designed to be a more accurate version of the NEDC and a test for electric vehicles. It effectively replaced the NEDC cycle in 2019.
There are various reasons why the WLTP is much better than the NEDC.
First, the vehicles are categorized into three different classes. To make this differentiation, WLTP uses the power to weight ratio. This means you can't submit a McLaren 720S, thinking it will be subjected to the same testing procedure as a Mini hatch.
More importantly, the WLTP uses more realistic acceleration times. Not only will the resulting figures be more accurate, but it supposedly engages the turbos of small-displacement turbocharged engines.
It would take up to 1,000 words to work through every category's parameters, so let's focus on the high-performance (Class 3) cycle to demonstrate the difference.
The WLTP cycle still takes place in a controlled laboratory for the record. The emissions tests are conducted in the real world, however.
The test cycle is recorded in seconds and is run over four cycles: low, medium, high, and extra high. The amount of time dedicated to each is dedicated by how much time the average car spends doing certain things. Most of the time is dedicated to low-speed traffic conditions. At the extra-high level, the top speed is 81 mph.
The critical differences at play are higher average and top speeds, a longer testing distance, more fierce acceleration and deceleration, and more driving conditions. This test does not calculate highway mpg by combining the results of two separate trials. It has a separate section for highway testing.
Another unique aspect is that manufacturers can't get a favorable result by sending the most basic, lightweight model in a range. The WLTP will test the lightest model, but it will also request a fully-laden model with additional features.
If you send an RWD pickup truck with a base engine, the WLTP will also request a 4WD model with the largest engine available.
Like the rest of the tests in this article, the EPA's process also takes place in a lab. A car is subjected to two tests: city and highway driving. The EPA then uses these two figures to create the third figure you'll normally see in an EPA rating, which is the combined figure.
For the city test, the car is driven for 11 miles and 31 minutes. The top speed is 56 mph, while the average speed is 20 mph. The car stops and accelerates a total of 23 times during the test. A test engineer will have a real-time display at their disposal to ensure every test happens the same way. Like all of the other tests, all of the car's accessories are turned off.
The EPA then further deducts 10% to get a real-world figure.
The highway test is completed with a warmed-up engine and takes place over 10 miles and 12.5 minutes. The average speed is 48 mph, and the top speed is 60 mph. Once again, all of the accessories, like the air-conditioning, are switched off.
What makes the EPA unique is the three other tests it also conducts. There is a separate test for high-speed driving, with a top speed of 81 mph. The other tests include stop-and-go traffic with air-conditioning use and consumption in cold weather. The EPA also uses exhaust gases to see how much fuel was consumed. During the entire test, it never looks at the fuel gauge.
There are flaws. The 10% correction is weak, and the measures haven't been updated since the mid-80s. The EPA tests roughly 15% of cars and relies mostly on manufacturer figures.
The manufacturers supply easily attainable figures, if only not to get sued.
The NEDC is defunct, which means the WLTP is the new accepted global standard everywhere but America.
A car is subjected to a 30-minute test cycle that balances city and highway driving. EVs are also subjected to higher speeds and more realistic temperatures.
Fact is, these tests still take place in a lab, so you don't get a real-world figure. Not one of the test cycles in this article is capable of giving the consumer an actual real-world figure.
Having said that, the WLTP is more trustworthy than the outdated NEDC.
According to the J.D. Power Ownership Survey, the WLTP's estimated range is around 10% more than what the car is capable of. That's a significant improvement over the NEDC, which used to overestimate by 25 to 30%.
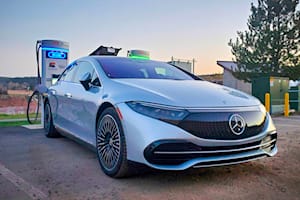
Once again, the EPA doesn't mess around. Instead of a 30-minute test, the EPA charges an EV to 100%. It's then left overnight like most consumers would do.
Following that, it goes on the rolling road, where it's subjected to various scenarios, including city and highway driving. The EPA runs the test until the battery is drained, and then the car is charged back up and subjected to the test again.
Most EV owners never run their battery down to zero percent. You use an EV like you use a smartphone. After a day of work, it's at 23% (just a random number), and you plug it in.
There have been many cases of EVs having more range than the EPA estimate, but we see that as good. We'd much rather have a car underpromise and overdeliver than overpromise and underdeliver.
It's the fairest way to level the playing field. Sure, it would be easy enough to construct a test track to get as close as possible to real-world figures, but the EPA has no control over the weather.
Allow us to demonstrate via an example. Let's say a Rivian R1T arrives on a sunny day with no wind. The conditions are ideal, and it gets a stellar range rating. A few months later, the Ford F-150 Lightning arrives, but it's cold, and there's a strong wind directly from the front. This will give the Rivian an unfair advantage, so a rolling road in a lab is the standard globally.
The point is that all consumption and range tests are flawed, but the EPA is the least imperfect of them all. If you want the most accurate results, the EPA figures are the way to go.
Always keep in mind that all of these tests don't account for the most important thing, which is the driver. If you hypermile, you'll likely beat the rating quickly enough. But if you're a normal human being who can't stand the thought of driving turtle-like or without the air-conditioning blasting cold air, you'll get lower figures.
Either way, the EPA figures are the most accurate third-party figures you can use when buying a car. Whether you drive frugally or more enthusiastically, it gives you some indication of what you can expect.


 Acura
Acura
 Alfa Romeo
 Aston Martin
 Audi
Audi
 Bentley
 BMW
BMW
 Bollinger
 Bugatti
 Buick
Buick
 Cadillac
 Caterham
 Chevrolet
 Chrysler
 Dodge
Dodge
 Ferrari
 Fiat
Fiat
 Fisker
 Ford
Ford
 Genesis
 GMC
GMC
 Hennessey
 Honda
Honda
 Hyundai
 Infiniti
 Jaguar
 Jeep
Jeep
 Karma
Karma
 Kia
Kia
 Koenigsegg
 Lamborghini
 Land Rover
 Lexus
Lexus
 Lincoln
 Lordstown
 Lotus
Lotus
 Lucid Motors
 Maserati
 Mazda
Mazda
 McLaren
 Mercedes-Benz
 Mini
Mini
 Mitsubishi
 Nissan
 Pagani
 Polestar
 Porsche
 Ram
Ram
 Rimac
Rimac
 Rivian
 Rolls-Royce
 Spyker
 Subaru
 Tesla
Tesla
 Toyota
 Volkswagen
 Volvo
Volvo
Join The Discussion